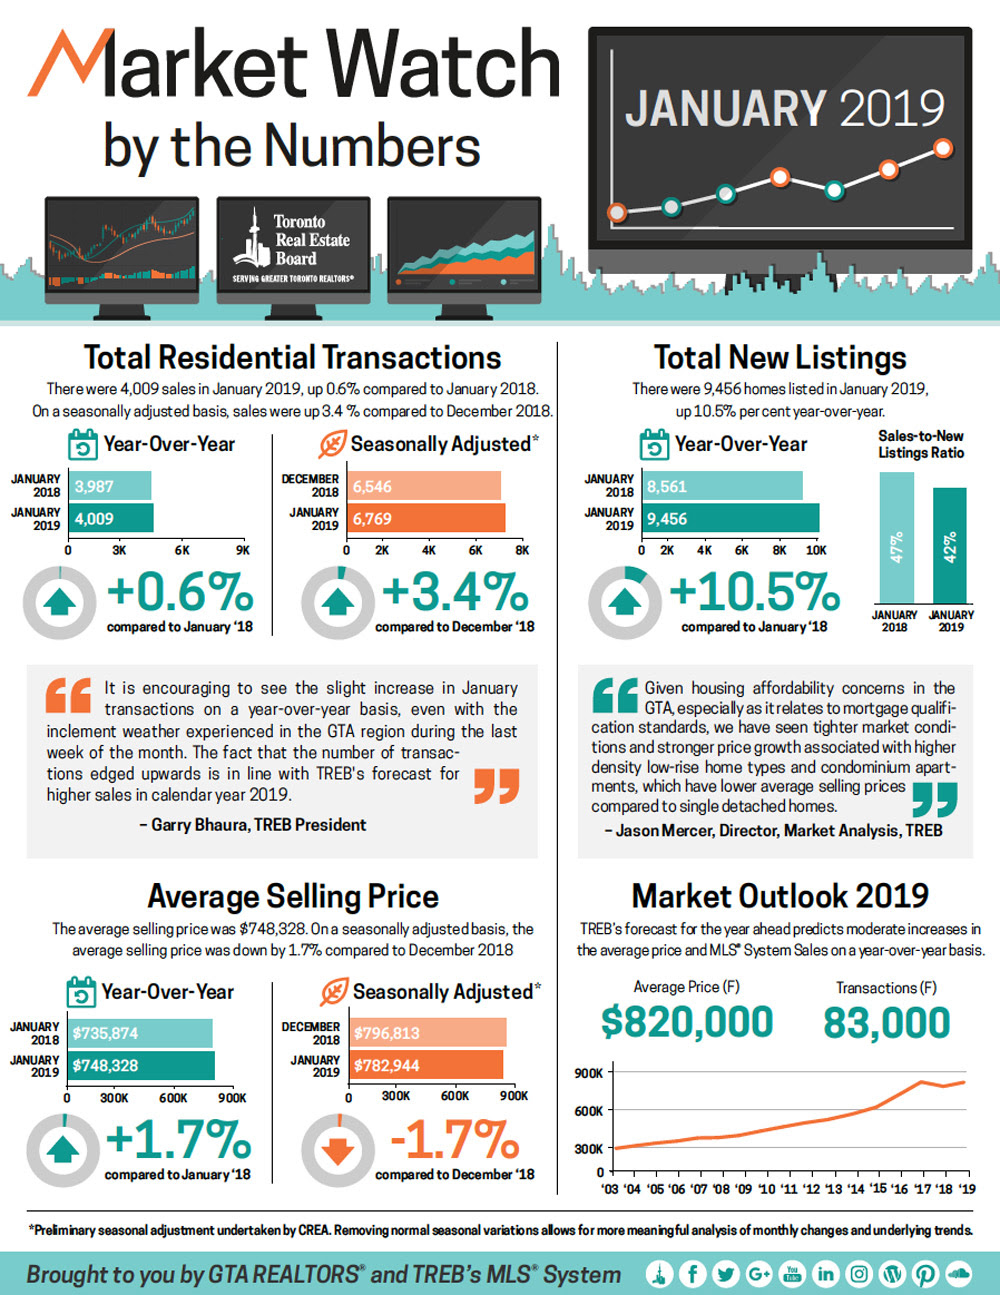
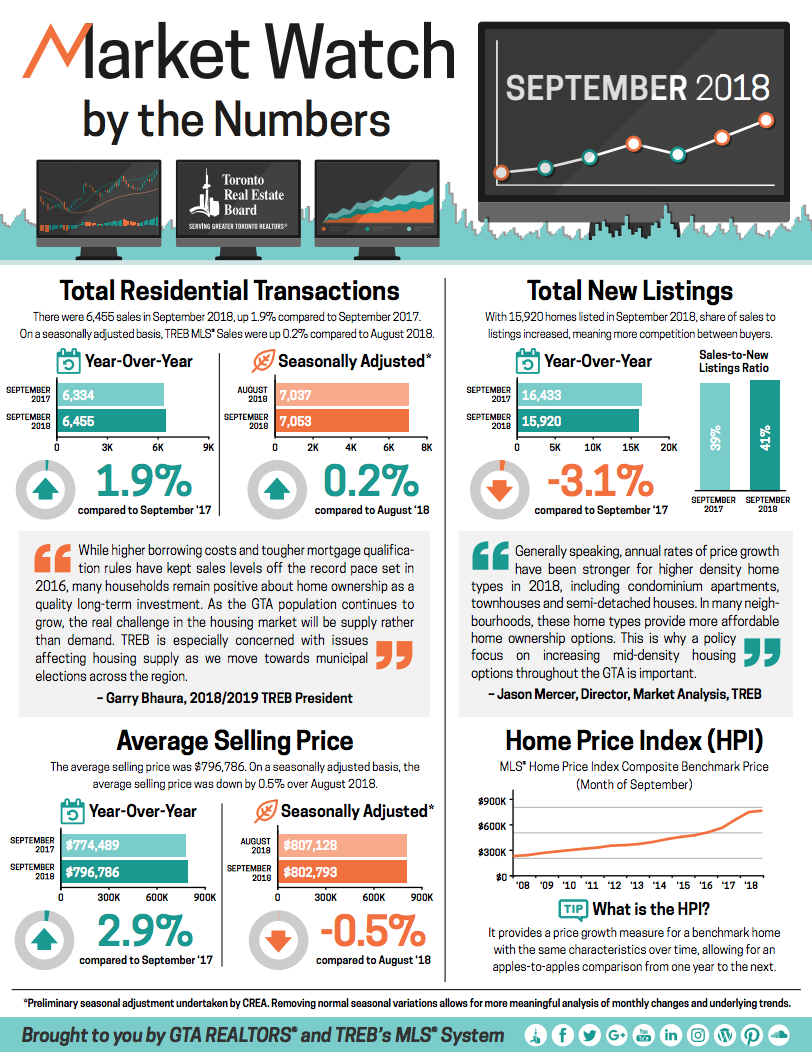
Following are the key Toronto Real Estate Boards’ housing stats that were published yesterday for your review. The new charts are designed to showcase key indicators about Toronto’s residential Real Estate Market in a visual presentation.
Following are some points worth noting:
- Sales for June 2010 were lower than June 2009 but almost at the same level at 2008 which hasn’t been the case since April 2009
- Number of new listings while higher than last year is below the 2008 levels which gave way to a correction in late 2008
- MLS Sales-to-new listings ratio moved higher compared to May 2010 which normally means an average price growth
- Average resale home price is much higher than previous three years but slipped for the first time this year on a month to month basis
- Over all sales are down and this is resulting in higher level of inventory in the market
Toronto Real Estate – Housing Market Charts – June 2010
View more presentations from HeyAddy.com.
I hope you enjoy this timely market update. If you have any questions about the information provided or would like to obtain more information, please feel free to contact me directly.
The contributing factor,
Addy Saeed
 Torontonian Online Running in the fast lane! Real estate and more…


[New Post] Toronto Real Estate: Housing Market Charts June 2010 http://torontonianonline.com/?p=479 #fb